The Reason Your Marketing Isn’t Working Probably Isn’t Your Marketing
You’ve tested ad creatives.
You’ve changed agencies.
You’ve rewritten your homepage three times this year.
You’re posting on LinkedIn, sending emails, running campaigns and the numbers still feel like pushing water uphill.
The problem usually isn’t the marketing. It’s what’s underneath it.
Most businesses are not under-marketing.
They are under-positioned.
The message they’re putting into the world is unclear, generic, or interchangeable with five other businesses doing roughly the same thing.
And no amount of beautiful ad creative can rescue a message that fails the first test of marketing: can someone tell, in one sentence, why they should pick you over the alternative?
This is a brand positioning problem.
And until you fix it, every marketing dollar you spend works at 30% of its potential.
This guide gives you the 5-question framework to diagnose and rebuild your positioning whether you’re a service business, an e-commerce brand, or a founder launching something new.
What Brand Positioning Actually Is (And What It Isn’t)
Positioning gets confused with branding, marketing, and messaging constantly.
Let’s draw the line clearly.
Brand positioning is:
The deliberate choice of who you’re for, what problem you solve, what makes you different, and what you want to be remembered for is captured in language that’s simple enough for a stranger to repeat back to you.
Brand positioning is not:
Your logo
Your colour palette
Your tagline
Your social media aesthetic
A list of services on your website
Those are expressions of positioning, not positioning itself.
A clean logo on top of confused positioning is still confused positioning just in a nicer font.
The simplest test: a brand with strong positioning can finish this sentence without hesitation “We help [specific audience] achieve [specific outcome] without [specific frustration], using [specific approach].”
If you can’t finish that sentence, or it sounds like every competitor’s version, positioning is your bottleneck not your ads, not your content, not your sales calls.
3 Symptoms Every Under-Positioned Business Recognises
Before the framework, here’s how to know positioning is the actual problem.
Symptom 1 — Your ads underperform regardless of creative.
You test new images, new copy, new offers. Click-through rates stay flat.
Cost per lead stays high.
That’s the signal that the message itself isn’t landing not that the visuals are off.
Symptom 2 — Sales calls get stuck on “what do you actually do?”
If prospects need a 20-minute explanation before they understand your offer, your positioning is doing the work that should already have happened on your homepage.
Strong positioning shortens the sales cycle because the buyer arrives half-sold.
Symptom 3 — Referrals describe you differently than you describe yourself.
Ask three existing clients to describe what you do in one sentence.
If they give three different answers, you don’t have positioning, you have noise.
Worse, the noise is multiplying every time someone refers you.
If two or more of these sound familiar, positioning is the highest-leverage fix you can make this quarter.
The 5-Question Brand Positioning Framework
This is the framework we use with clients at EDSAN.
Answer all five honestly and you’ll come out with positioning that’s sharper than 90% of competitors in your space.
Question 1 — Who exactly do you serve?
Most businesses answer this with breadth: “
We serve small businesses.”
Or worse:
“We work with anyone who needs our service.”
Breadth is the enemy of positioning.
The narrower you can describe your ideal customer, the more powerfully your message will land including, paradoxically, with people outside that narrow definition.
Weak answer:
“We help businesses grow.”
Strong answer:
“We help fashion e-commerce brands doing $500k–$5m in annual revenue scale email marketing without hiring an in-house team.”
The strong version eliminates 95% of the market.
That’s the point. The 5% who fit are now 10× more likely to choose you.
Question 2 — What problem do you solve that no one else solves the same way?
This is the question most businesses skip.
They describe what they do (the service) instead of the problem they solve (the customer’s pain).
Customers don’t buy services.
They buy outcomes.
And they buy outcomes from the business that names the problem most precisely.
Weak answer:
“We do email marketing.”
Strong answer:
“We turn cold email lists into predictable monthly revenue, so founders stop relying on ad spend to hit their numbers.”
The second version names the real pain (ad dependency) and the real outcome (predictable revenue).
The service is the means, not the message.
Question 3 — What do you stand for that competitors don’t?
This is your point of view.
Your hill.
The thing you say loudly that the rest of your industry won’t.
Strong positioning is always a little bit controversial because to stand for something, you have to be willing to stand against something else.
Weak answer:
“We believe in quality service and great results.”
Strong answer:
“We believe most agencies are vendors, not partners and that you should fire any agency that won’t show you their dashboard.”
The strong version creates a category.
Customers who agree are now 5× more loyal.
Customers who don’t agree weren’t going to buy from you anyway.
Question 4 — What’s the proof?
Positioning without proof is just claims.
Strong positioning anchors its difference in something concrete case studies, data, certifications, partnerships, methodology, or measurable client outcomes.
Weak proof:
“Trusted by hundreds of clients.”
Strong proof:
“Klaviyo Partner. 30–60% added monthly email revenue for fashion e-commerce brands. Case studies available on request.”
Specificity reads as credibility. Vagueness reads as marketing.
Question 5 — What’s the one thing you want them to remember?
If a customer can only remember one sentence about your business 30 days from now, what is it?
This is your positioning statement.
It should be short enough to repeat at a dinner party, specific enough to differentiate, and emotional enough to stick.
Weak:
“We do marketing for small businesses.”
Strong:
“We’re the email engine for fashion brands ready to grow without burning more on ads.”
The strong version is sticky because it names the who, the what, and the why in twelve words.
How to Test If Your Positioning Is Working: The 3-Person Test
After you’ve answered all five questions, run this test before you commit:
Send your positioning statement (Question 5) to three people who know your business: a client, a peer, and someone outside your industry.
Ask each of them to describe what you do in their own words, the next day, without re-reading the statement.
If all three describe you similarly, your positioning works.
If you get three different answers, the statement is too vague or too clever rewrite and retest.
This is the cheapest, most honest brand research you can run.
It catches problems no internal team will catch, because the people inside your business already know what you mean.
Real Examples: Weak vs Strong Positioning
These are not specific brands, they’re composite examples drawn from common patterns we see in audits.
Weak (Skincare brand):
“Premium skincare for radiant, healthy skin.”
Strong (Skincare brand):
“Skincare for women over 40 who want results without 12-step routines or ingredient confusion. Made in small batches, tested on humans.”
The strong version named the audience (women over 40), the specific frustration (complicated routines), the proof point (small batches, human-tested), and a point of view (against the 12-step trend).
Weak (Service business — accountant):
“Trusted accounting services for small businesses.”
Strong (Service business — accountant):
“We help creative agency owners read their numbers in 10 minutes a month so they spend the rest of the time running the business, not decoding spreadsheets.”
The strong version positioned around an audience (creative agency owners), a frustration (time spent on numbers), and a clear outcome (10 minutes a month).
Weak (Coach):
“Helping leaders unlock their potential through transformational coaching.”
Strong (Coach):
“I help newly promoted directors at mid-sized tech companies stop being managers and start being leaders in 90 days, without the corporate retreat clichés.”
Same coaching service.
But the strong version is bookable.
The weak version is invisible.
How Strong Positioning Cuts Your Marketing Costs
Here’s the part most founders miss: positioning is not just a brand exercise. It’s a cost exercise.
When positioning is sharp:
Your ads need less creative testing to find what works
Your sales calls shorten because prospects arrive pre-qualified
Your email open rates climb because the audience self-selected
Your content goes further because each piece reinforces the same point
Your team stops disagreeing about who you’re for
Look at the difference between a fashion brand with strong positioning (“the everyday minimalist label for women 30+”) and one with weak positioning (“modern apparel for the contemporary woman”).
The first runs a Klaviyo welcome flow that converts 14%.
The second runs the same flow and converts 4%.
Same Klaviyo.
Same offer.
Different positioning underneath.Positioning is the multiplier on every marketing system you’ll ever build.
5 Positioning Mistakes That Quietly Kill Marketing Performance
Mistake 1 — Positioning around the product, not the customer.
“We sell premium leather bags” is product-led.
“We make bags for women who hate replacing them every two years” is customer-led.
The second outsells the first every time.
Mistake 2 — Trying to serve everyone.
Every business that tries to serve “anyone” ends up speaking to no one.
Narrow positioning expands your real market broad positioning shrinks it.
Mistake 3 — Confusing positioning with branding.
You can have beautiful branding and broken positioning.
You cannot have strong positioning and weak marketing.
Positioning comes first.
Mistake 4 — Changing positioning every six months.
Positioning needs at least 18–24 months to compound in the market.
If you rewrite it after every slow quarter, no one ever has time to remember it
.Mistake 5 — Borrowing positioning from a bigger competitor.
The position that worked for Apple, Nike, or Glossier worked because they got there first.
Borrowing it makes you a footnote in their story.
Your positioning needs to come from your customer, not their press release.
Frequently Asked Questions
How often should I revisit my brand positioning?
Every 18–24 months at minimum, or whenever you significantly shift your audience, expand into new services, or notice the 3 symptoms in this guide. Positioning should be stable enough to compound but reviewed often enough to stay accurate.
Can a small business actually compete on positioning?
Small businesses win on positioning. Large brands have to position broadly to serve broad markets. Small businesses can position narrowly, claim a specific niche, and dominate it — long before a bigger competitor notices the category exists.
Is positioning the same as a value proposition?
Closely related, but not identical. Positioning is the strategic decision — who you’re for, what you stand for, what makes you different. Value proposition is the expression of that positioning in customer-facing language. You need both, but positioning comes first.
How long does it take to develop strong positioning?
A focused positioning sprint takes 2–4 weeks. The bigger time investment is testing it in market — landing pages, ads, sales calls — for 60–90 days to see if it lands. Most businesses don’t fail at developing positioning; they fail at committing to it long enough to compound.
Do I need an agency to position my brand?
Not always. The 5-question framework above is usable by any founder willing to be honest. An external partner helps because positioning requires saying no to audiences and services you’ve been holding onto for years — and that’s easier with someone whose job isn’t to make you feel comfortable.
How do I know if my positioning is “working”?
Three signals: shorter sales cycles, better referral language (customers describe you the
The Bottom Line
Most businesses scale marketing before they scale clarity.
They run ads on top of unclear positioning, hire teams to write content for unclear messaging, and rebuild websites that say the same vague thing in nicer typefaces.
Then they wonder why the numbers don’t move.
The fix isn’t more marketing. It’s a clearer positioning.
Answer the five questions.
Run the 3-person test.
Commit to it for 18 months.
Then watch how every marketing dollar you spend starts working harder, not because the marketing got better, but because the message underneath finally became something worth marketing.
If you’d like a free 30-minute Brand & Marketing Positioning Audit, we’ll walk through your current positioning, identify the gaps, and show you the three highest-leverage moves to sharpen it — book a strategy call here.
The First Email a Fashion Subscriber Gets Decides 30–40% of Their Lifetime Value
Most fashion brands obsess over the weekly promo blast and ignore the email that actually matters: the first one a new subscriber ever opens.
According to Klaviyo’s 2026 benchmark report, welcome flows are the single highest-revenue-per-recipient automation in any e-commerce account — outperforming campaigns by 16× per email sent.
Yet the average fashion brand we audit either has no welcome flow at all, or one single “thanks for subscribing, here’s 10% off” email sent five years ago and forgotten.
That single missing flow is quietly costing most fashion stores between $4,000 and $40,000 a month, depending on list size.
This guide breaks down the exact 5-email Klaviyo welcome flow we install for fashion clients in 2026 — the timing, the subject lines, the copy structure, the Klaviyo setup, and the benchmarks to measure against.
By the end you’ll have a blueprint you can build this week.
What “Good” Looks Like: 2026 Welcome Flow Benchmarks for Fashion
Welcome Flow Benchmarks for Fashion & Apparel (2026)
Metric
Below Average
Average
Good
Excellent
Email 1 Open Rate
< 45%
50–55%
55–65%
65%+
Email 1 Click Rate
< 4%
5–8%
8–12%
12%+
Flow Placed Order Rate
< 4%
5–8%
8–14%
14%+
Revenue per Recipient (full flow)
< $1.50
$2.00–$3.50
$3.50–$6.00
$6.00+
Reality check: Reported open rates are inflated by Apple Mail Privacy Protection — assume your real engaged open rate is 15–20 percentage points lower.
That’s why placed order rate and revenue per recipient (RPR) are now the two metrics that actually matter for a welcome flow.
Before the blueprint, here’s what we see going wrong in 9 out of 10 fashion welcome flows we audit:
1. One email, not a flow.
A single “welcome + 10% off” email is not a flow. It’s a thank-you note.
The 5-email structure exists because different buyers convert at different friction points.
2. The discount lands in email 2.
By the time the discount appears, the subscriber has already lost momentum.
The highest-revenue welcome flows put the offer in Email 1, immediately after signup.
3. Brand story before product.
Fashion brands love to lead with “our story.” But a new subscriber doesn’t care about your founder narrative yet — they care about whether the product is worth their money.
Story comes after you’ve earned the click.
4. No exit criteria.
Subscribers who purchase during Email 2 still receive Emails 3, 4, and 5 begging them to buy.
This kills trust and burns the relationship.
5. The same CTA on every email.
“Shop now” five times in two weeks isn’t a flow — it’s nagging. Each email needs a different angle and a different reason to click.
The 5-Email Klaviyo Welcome Flow Blueprint
Here is the structure we install for fashion clients. Send timing is in hours after signup.
Framework 5 — Restock / scarcity (real, not fake)“Your size just came back”
Stop using:
ALL CAPS — now mostly filtered to spam
“Last chance” — open rate collapsed 18 months ago
3+ emojis in one subject line — reduces opens in apparel by ~6%
Generic “Welcome to [Brand]” — no curiosity, no click
How to Build It in Klaviyo (The Setup Walkthrough)
Here’s how the flow looks inside Klaviyo:
Flow trigger:Subscribed to List → Newsletter (or your master signup list)
Filters:
Has not placed an order in the last 30 days (so existing customers who re-subscribe aren’t sent a welcome series)
Is not currently in another active flow (avoid stacking)
Time delays: Match the schedule above — 0h, 48h, 96h, 168h (7 days), 336h (14 days).
Conditional split (after Email 1):
Placed an order = Yes → Skip to Email 5 (or exit flow entirely)
Placed an order = No → Continue to Email 2
Repeat that conditional split before Emails 3, 4, and 5.
The moment someone buys, they should exit the welcome flow and enter the post-purchase flow instead.
Smart Send Time: Turn it on for every email in the flow. It costs nothing and adds 5–9 points to opens.
UTM tracking: Use Klaviyo’s auto-UTM tagging so every welcome flow click shows in GA4 as utm_source=klaviyo&utm_medium=email&utm_campaign=welcome_e1 (etc.).
Without this, you can’t tell which email drove which revenue.
How to Measure If Your Welcome Flow Is Working
Three KPIs. Anything else is noise.
1. Placed Order Rate (Flow-Level) Should be 8–14% across the full 5-email flow for fashion.
If you’re under 5%, the flow needs rebuilding — start with Email 1, where the most revenue is won or lost.
2. Revenue per Recipient (RPR) The single best KPI in 2026 because it’s immune to Apple MPP inflation.
Target: $3.50+ across the full flow for fashion.
Anything below $2.00 means your subject lines, offer, or product mix is off.
3. Email-to-Purchase Time The median time from welcome signup to first purchase.
For high-performing fashion flows this is under 7 days.
If yours is 30+, your urgency mechanics are weak.
Track all three monthly. Improvements compound — a flow that delivers $4 RPR on a 20,000-subscriber list is doing $80,000/year on autopilot.
A flow at $1 RPR on the same list is doing $20,000. Same list, same traffic, same store — only the flow changed.
6 Common Welcome Flow Mistakes That Kill Conversion
1. Sending all 5 emails in 3 days.
Burns the relationship before it starts. Use the 14-day spread.
2. No exit criteria after purchase.
Sending “use your discount” to someone who already used it makes you look broken.
3. Identical subject line styles across all 5 emails.
Algorithms downgrade lookalike subject lines from the same sender.
Mix personalisation, urgency, curiosity, and social proof.
4. Weak Email 1 CTA.
“Shop now” linking to your homepage is the lowest-converting choice possible.
Link to a curated collection — bestsellers or new arrivals.
5. No mobile design check.
65%+ of fashion email opens happen on mobile.
If your hero image doesn’t render under 600px wide, you’re losing 60% of revenue.
6. Never updating the flow.
A welcome flow built in 2023 is not a 2026 flow.
Refresh subject lines and offers every 6 months. Klaviyo’s data shows refreshed flows lift RPR 12–25% on average.
Frequently Asked Questions
How many emails should a fashion welcome flow have?
Five is the sweet spot. Three is too short to capture slow deciders. Seven or more starts feeling spammy and erodes engagement. Five emails over 14 days hits the highest revenue-per-recipient in Klaviyo’s 2026 apparel benchmarks.
Should I offer a discount in the first welcome email?
Yes — but only if your margin allows. The data is clear: brands that put the discount in Email 1 see 2–3× the placed order rate of brands that hold it back. If discounting hurts your margin, use free shipping or a free gift with purchase instead.
What’s a good conversion rate for a welcome flow?
8–14% placed order rate across the full 5-email flow is the fashion benchmark in 2026. Excellent flows hit 14%+. Anything below 5% means the flow is broken.
Should I use Klaviyo’s default welcome template?
No. The default templates are designed to look generic on purpose — they have to work for every industry. Build a custom flow that matches your brand voice, your customer’s actual buying behaviour, and the conditional logic above.
How long should my welcome series be?
14 days, with 5 emails. Shorter than 7 days feels aggressive. Longer than 21 days, subscribers forget they signed up and your unsubscribe rate spikes.
Do I need different welcome flows for different traffic sources?
Eventually, yes. Once you cross 5,000 monthly signups, split your flow by source — TikTok signups, paid ad signups, and pop-up signups all have different intent levels and should get slightly different first emails. Start with one universal flow and segment later.
How quickly should I see results after building this flow?
Klaviyo welcome flows start producing revenue within 24 hours of going live (because the trigger is real-time). You’ll have meaningful benchmark data in 30 days, and a clear sense of whether the flow needs optimisation in 60.
The Bottom Line
If you have a fashion store and you haven’t installed a proper 5-email welcome flow, you are leaving the easiest revenue in your entire business on the table — every single day.
The math is simple: a welcome flow at $3.50 RPR on a list that adds 1,000 subscribers a month is generating $3,500/month from emails you wrote once.
Compounded across a year, that’s $42,000 of fully automated revenue from one flow.
Don’t optimise campaigns until your welcome flow is doing its job.
Build it.
Measure RPR and placed order rate.
Refresh every 6 months.
Watch what happens when the highest-leverage flow in your account starts pulling its weight.
If you’d like a free Klaviyo welcome flow audit — we’ll review your current setup, identify what’s broken, and show you the three highest-revenue fixes —book a free 30-minute strategy call here.
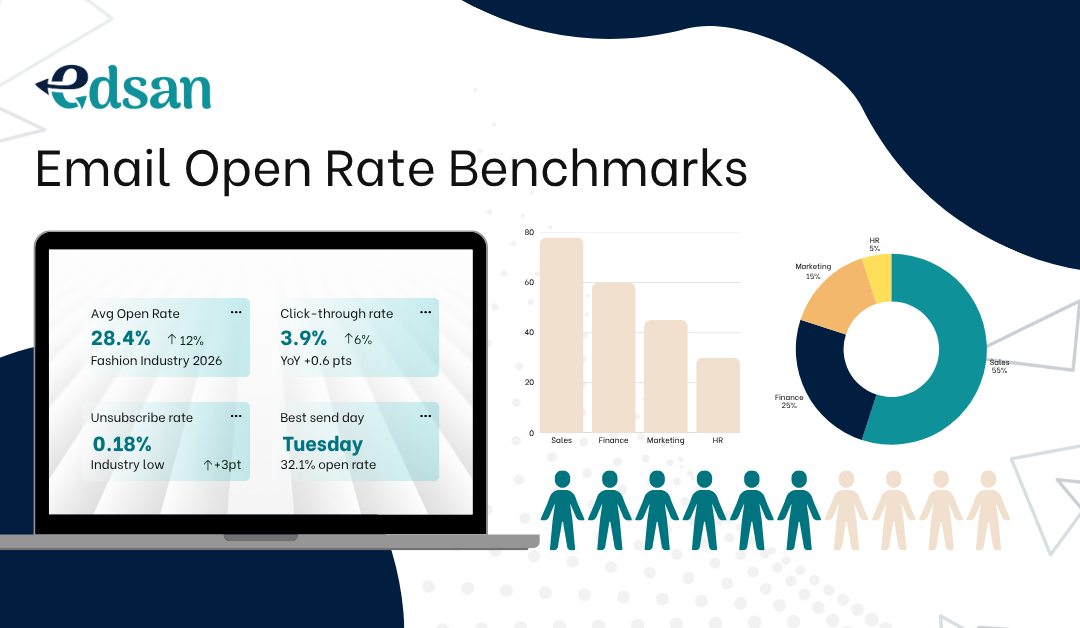
How You Actually Compare in 2026 (And Why Old Benchmarks Are Lying to You)
You sent a promo email to your fashion store list. Open rate: 18%.
You check a “2026 benchmark” article and it says the industry average is 22%. You panic.
You assume you’re underperforming.
Here’s the problem: most benchmark articles published in 2026 are quoting numbers from 2019.
They haven’t been updated for Apple Mail Privacy Protection (MPP), Gmail’s image proxying, the rise of automated flows, or the actual data Klaviyo released for the apparel category.
This guide uses the latest 2026 data from Klaviyo’s benchmark report (built on 183,000+ ecommerce brands), Litmus’s email analytics, and live industry reporting — so you know what “good” actually looks like right now, and where to focus your effort.
Quick Answer: The Real Fashion Email Open Rate
Benchmarks (2026)
Based on Klaviyo’s 2026 benchmark report and verified across multiple data sources, here’s what fashion and apparel ecommerce brands are actually achieving today.
Campaign Open Rates by Email Type (Fashion & Apparel)
Important context: These are reported open rates. Apple Mail Privacy Protection (MPP) inflates these numbers by 15–20 percentage points across the board because it pre-fetches tracking pixels for ~49% of all opens (Litmus, 2026).
Your real engaged-human open rate is closer to 20–28% on a promo email that reports 32%.
Email Type
Below Average
Average
Good
Excellent
Welcome Flow (Email 1)
< 45%
50–55%
55–65%
65%+
Promotional Campaign
< 28%
30–34%
35–42%
42%+
Abandoned Cart
< 45%
50–53%
55–65%
65%+
Browse Abandonment
< 40%
45–50%
50–58%
58%+
Post-Purchase
< 40%
45–52%
52–60%
60%+
Re-engagement / Win-back
< 18%
22–28%
28–35%
35%+
VIP / Loyalty
< 40%
45–55%
55–65%
65%+
Why the Old “22% Promo Open Rate” Number Is Wrong
Many fashion marketing guides still quote 18–22% as the promotional benchmark.
This number came from pre-2021 data, before three structural shifts:
Apple Mail Privacy Protection (Sept 2021) — Apple now pre-fetches every email image, registering an “open” whether or not the recipient saw the message. ~58% of all email opens now flow through Apple Mail.
Klaviyo’s market dominance in ecommerce — Klaviyo’s data set is 4× larger and more apparel-weighted than the legacy Mailchimp benchmarks most articles still cite.
The flow vs campaign split — Open rates on automated flows (welcome, cart, browse) are now structurally far higher than batch campaigns. Averaging them together hides the real story.
The corrected 2026 fashion campaign benchmark is 30–34% — not 22%.
If you’re hitting 18%, you’re not “just below average.” You’re significantly underperforming and have major room to improve.
The Metric That Actually Matters Now: Click Rate & Click-to-Open Rate
Because MPP has compromised open rates, sophisticated email teams have shifted their primary KPI to click rate and click-to-open rate (CTOR) — both of which are immune to MPP inflation.
Fashion & Apparel Click Rate Benchmarks (2026)
Email Type
Below Average
Average
Good
Excellent
Promotional Campaign
< 0.5%
0.8–1.2%
1.5–2.5%
2.5%+
Welcome Flow
< 3%
4–6%
7–10%
10%+
Abandoned Cart
< 4%
5–7%
7–10%
10%+
Browse Abandonment
< 2%
3–5%
5–8%
8%+
Post-Purchase
< 2%
3–5%
5–7%
7%+
Key insight from Klaviyo’s 2026 data: Fashion & apparel has the lowest campaign click-through rate of any ecommerce vertical (~0.98%).
This is not a failure — it’s structural.
Fashion audiences are inundated with daily promo emails, and most just scan visuals.
Your job is to beat fashion-specific CTR benchmarks, not generic e-commerce ones.
The Biggest Untold Story in 2026: Flows vs Campaigns
Here is the single most important statistic in fashion email marketing right now, and it almost never appears in benchmark articles:
In 2026, automated email flows generated 41% of total email revenue — from just 5.3% of email sends.
Revenue per email for flows is $2.87 vs $0.18 for batch campaigns — a 16× difference. (Source: Klaviyo 2026 Benchmark Report)
Translation: if you’re a fashion brand spending all your energy on the weekly promo blast, you are leaving 80%+ of your revenue on the table.
The leverage is in flows — welcome, browse abandonment, abandoned cart, post-purchase, and win-back.
What this means for benchmarking: Stop measuring yourself only on campaign open rates. Start measuring:
Flow open rates (should be 45–65%+ across the board for fashion)
Flow click rates (should be 4–10%+ depending on type)
Revenue per recipient (RPR) — the single best KPI in 2026
Why Fashion Ecommerce Has Distinct Benchmarks
Fashion sits in a unique benchmark category for four reasons:
1. Visual category, high preview engagement.
Subject lines compete with hero images that often render in preview panes — meaning subject line tweaks have less leverage in fashion than in services or SaaS.
2. Mobile-first audience.
Over 65% of fashion email opens happen on mobile devices (Litmus 2026).
Subject lines must work at 35–40 characters; longer ones get truncated.
3. Daily promo saturation.
The average fashion subscriber is on 14+ brand lists.
This is why fashion CTRs are structurally lower than the ecommerce average — not because your copy is bad.
4. Promotions tab placement.
Gmail’s Promotions tab catches most fashion promo emails.
Brands that move flows (welcome, cart) to Primary inbox see open rates jump 8–15 points.
How to Read Your Open Rate Honestly in 2026
Instead of asking “Am I at 22% or 28%?” — ask these four questions:
1. What’s my real (non-MPP) open rate?
Subtract ~15–20 percentage points from your reported number for an estimate of true engaged opens.
If you reported 32% and your Apple Mail share is 60%, your real open rate is closer to 22%.
2. What’s my click rate?
This is the only opens-adjacent metric that is honest.
If your campaign CTR is below 0.8%, fix this before touching subject lines.
3. What’s my conversion rate per send?
Multiply opens × clicks × purchase rate.
Fashion benchmark for promo campaigns: 0.05–0.15% of sends convert to purchase.
For abandoned cart flows: 2.5–5%.4.
What’s my revenue per recipient (RPR)? For campaigns: $0.10–$0.30 = average; $0.30–$0.70 = good; $0.70+ = excellent.
For abandoned cart flows: $3.00–$8.00 per recipient is the apparel norm.
How to Improve Your Fashion Email Open Rates (8 Tactics That Actually Move the Needle in 2026)
Tactic 1 — Invest in Flows Before Campaigns
If you don’t have these four flows running with at least 4 emails in each, build them this week:
Welcome series (5 emails over 14 days)
Browse abandonment (3 emails over 48 hours)
Abandoned cart (4 emails over 4 days)
Post-purchase / cross-sell (4 emails over 30 days)
Expected lift: 25–40% of total email revenue, even at modest list size.
Tactic 2 — Optimise for the Primary Inbox
Promo emails land in Gmail’s Promotions tab. Flow emails land in Primary if formatted right.
Strip excessive imagery from flow emails (text-forward design)
Avoid HTML tables in welcome emails
Use a recognisable sender name (a person’s name beats a brand name in fashion: “Sarah from [Brand]”)
Expected lift: 8–15 points on flow open rates.
Tactic 3 — Segment by Engagement Recency, Not Just Purchase History
In 2026, the strongest segment is “engaged in last 30 days” — opened or clicked anything.
Send most of your volume to this segment.
0–30 day engagers: full send schedule
30–90 day engagers: 50% of send volume, more curated
90–180 day engagers: re-engagement flow only
180+ day: sunset (remove from active list)
Expected lift: 12–25% on reported open rate; 30%+ on click rate.
Tactic 4 — Write Subject Lines for Mobile First
Mobile cuts subject lines at 35–40 characters. Front-load the hook.
Works in fashion (2026):
“Sarah, your size just restocked” — first-name personalisation + scarcity
“The dress 3,400 women bought this week” — social proof + curiosity
“Sneakers worth waiting for” — soft curiosity, no urgency cliché
“20% off — but only your category” — relevance over volume
Stop using:
ALL CAPS subject lines (now mostly filtered to spam)
Generic “last chance” — open rate has collapsed for this phrasing
Emoji-stuffed lines (3+ emoji reduces opens in apparel by ~6%)
Tactic 5 — Use Send-Time Optimisation (Not Guesswork)
The 2019 advice “send Tuesday 10am” is outdated.
Today, you should be using Klaviyo Smart Send Time or send-time AI in your ESP.
It sends to each recipient at the time they’re most likely to open.
Expected lift: 5–9 points on opens, 2–4 points on clicks.
If you must batch-send: best windows for fashion in 2026 are Tuesday/Wednesday 11am–1pm and Sunday 6–8pm (evening browsing).
Worst windows are Monday 8–10am and Friday 4–6pm.
Tactic 6 — Clean Your List Aggressively
Your sender reputation in Gmail and Outlook is driven by engagement rate, not list size.
Remove anyone who hasn’t engaged in 180 days.
A 20,000-person list with a 35% open rate beats a 100,000-person list with a 15% open rate — every time, for revenue and deliverability.
Expected lift: 10–20 points on reported open rate; ~3× improvement in inbox placement.
Tactic 7 — Build a Smart Re-engagement Flow Before You Sunset
Before removing inactive subscribers, run a 3-email win-back flow:
Email 1: “Did we lose you?” — soft re-engagement, no offer
Email 2: “Here’s 15% off — we’d love you back” — incentive
Email 3: “Last email — confirm you want to stay subscribed” — explicit opt-in
Anyone who doesn’t click in this sequence gets removed.
This is a deliverability hygiene step, not a marketing one.
Tactic 8 — A/B Test Click-Through, Not Just Opens
Because MPP has destroyed the validity of A/B testing on open rate, only test using click rate or conversion as the success metric.
Test in this order:
Email content & CTA (highest impact)
Hero image
Subject line (yes, last — its impact has diminished)
Send time
Sender name
Frequently Asked Questions
What’s a good email open rate for fashion ecommerce in 2026?
For reported open rates: 30–34% on promo campaigns is average; 35–42% is good; 42%+ is excellent. But adjust your expectations down by 15–20 points if you want the “real” engaged-human number, because Apple Mail Privacy Protection inflates opens.
Are open rates still a useful metric?
Yes — but only as a directional signal, not a primary KPI. Use them to spot subject line problems and deliverability issues. Use click rate and revenue per recipient as your primary KPIs in 2026.
What’s the real impact of Apple Mail Privacy Protection?
MPP pre-fetches email images for ~49% of all tracked opens, inflating reported open rates by 15–20 percentage points. In Apple-heavy audiences (US, UK, fashion-skewing demos), up to 60% of “opens” can be artificial. This is the single biggest reason old benchmarks no longer apply.
Why is my fashion brand’s CTR lower than the ecommerce average?
Because fashion has the lowest CTRs in ecommerce — structurally. Klaviyo’s 2026 data puts apparel & accessories campaign CTRs at ~0.98%. Compare yourself to fashion-specific benchmarks, not generic ecommerce ones.
Should I prioritise flows or campaigns?
Flows. Klaviyo’s 2026 data shows flows generate 41% of email revenue from just 5.3% of sends — a 16× revenue-per-email advantage. If you have to choose, build your welcome, browse, cart, and post-purchase flows before sending another campaign.
How often should I review benchmarks?
Twice a year. Klaviyo, Litmus, and Omnisend publish updated apparel benchmarks each February and August. The market shifts faster than annual reports can capture.
The Bottom Line
The 2026 email landscape for fashion has changed more in the last 18 months than in the previous five years.
Apple MPP has broken the open rate as a clean metric.
Klaviyo’s flow-driven data has redefined what “good” looks like.
And fashion’s saturation problem makes generic e-commerce benchmarks misleading.
Stop chasing a 22% open rate that came from a 2019 report.
Build the flows, clean the list, segment by engagement, and measure click rate and RPR.
The fashion brands winning in 2026 stopped optimising for opens 18 months ago — they optimised for revenue per recipient. You can too.